import openseespy.opensees as ops
import openseespy.postprocessing.ops_vis as opsv
import matplotlib.pyplot as plt
# import opensees as ops  # local compilation
# import ops_vis as opsv  # local
ft = 12.
B,H = 30*ft, 13.*ft
ops.wipe()
ops.model('basic', '-ndm', 2, '-ndf', 3)

Acol, Agir = 576.0, 684.0
IzCol, IzGir = 27_648.0, 34_383.8

E = 3600.

Ep = {1: [E, Acol, IzCol],
      2: [E, Acol, IzCol],
      3: [E, Agir, IzGir]}

ops.node(1, 0., 0.)
ops.node(2, 0., H)
ops.node(3, B,  0.)
ops.node(4, B,  H)

ops.fix(1, 1, 1, 1)
ops.fix(3, 1, 1, 1)

ops.geomTransf('Linear', 1)

# columns
ops.element('elasticBeamColumn', 1, 1, 2, Acol, E, IzCol, 1)
ops.element('elasticBeamColumn', 2, 3, 4, Acol, E, IzCol, 1)
# girder
ops.element('elasticBeamColumn', 3, 2, 4, Agir, E, IzGir, 1)

Px = 2.e+3
Wy = -10.e+3
Wx = 0.

Ew = {3: ['-beamUniform', Wy, Wx]}

ops.timeSeries('Constant', 1)
ops.pattern('Plain', 1, 1)
ops.load(2, Px, 0., 0.)

# for etag in Ew:
#     ops.eleLoad('-ele', etag, '-type', Ew[etag][0], Ew[etag][1],
#                 Ew[etag][2])

ops.constraints('Transformation')
ops.numberer('RCM')
ops.system('BandGeneral')
ops.test('NormDispIncr', 1.0e-6, 6, 2)
ops.algorithm('Linear')
ops.integrator('LoadControl', 1)
ops.analysis('Static')
ops.analyze(1)

ops.printModel()
Current Domain Information
    Current Time: 1
tCommitted Time: 1
NODE DATA: NumNodes: 4

numComponents: 4
 Node: 1
    Coordinates  : 0 0
    Disps: 0 0 0
     unbalanced Load: 0 0 0
    ID : -1 -1 -1


 Node: 2
    Coordinates  : 0 156
    Disps: 5.51163 0.0248715 -0.0295316
     unbalanced Load: 2000 0 0
    ID : 3 4 5


 Node: 3
    Coordinates  : 360 0
    Disps: 0 0 0
     unbalanced Load: 0 0 0
    ID : -1 -1 -1


 Node: 4
    Coordinates  : 360 156
    Disps: 5.36679 -0.0248715 -0.0284346
     unbalanced Load: 0 0 0
    ID : 0 1 2

ELEMENT DATA: NumEle: 3

numComponents: 3
ElasticBeam2d: 1
    Connected Nodes: 1 2
    CoordTransf: 1
    mass density:  0, cMass: 0
    release code:  0
    End 1 Forces (P V M): -330.599 1009.32 97569.3
    End 2 Forces (P V M): 330.599 -1009.32 59885.1

ElasticBeam2d: 2
    Connected Nodes: 3 4
    CoordTransf: 1
    mass density:  0, cMass: 0
    release code:  0
    End 1 Forces (P V M): 330.599 990.677 95415
    End 2 Forces (P V M): -330.599 -990.677 59130.7

ElasticBeam2d: 3
    Connected Nodes: 2 4
    CoordTransf: 1
    mass density:  0, cMass: 0
    release code:  0
    End 1 Forces (P V M): 990.677 -330.599 -59885.1
    End 2 Forces (P V M): -990.677 330.599 -59130.7

SP_Constraints: numConstraints: 6

numComponents: 6SP_Constraint: 0     Node: 1 DOF: 1 ref value: 0 current value: 0
SP_Constraint: 1     Node: 1 DOF: 2 ref value: 0 current value: 0
SP_Constraint: 2     Node: 1 DOF: 3 ref value: 0 current value: 0
SP_Constraint: 3     Node: 3 DOF: 1 ref value: 0 current value: 0
SP_Constraint: 4     Node: 3 DOF: 2 ref value: 0 current value: 0
SP_Constraint: 5     Node: 3 DOF: 3 ref value: 0 current value: 0

Pressure_Constraints: numConstraints: 0

numComponents: 0
MP_Constraints: numConstraints: 0

numComponents: 0
LOAD PATTERNS: numPatterns: 1


numComponents: 1Load Pattern: 1
  Scale Factor: 1
Constant Series: factor: 1
  Nodal Loads:

numComponents: 1Nodal Load: 2 load : 2000 0 0

  Elemental Loads:

numComponents: 0
  Single Point Constraints:

numComponents: 0
PARAMETERS: numParameters: 0


numComponents: 0
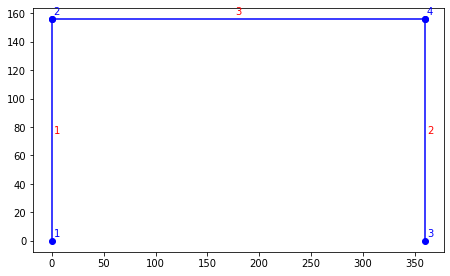
# 1. plot model with tag lebels

szer, wys = 16., 10.

fig = plt.figure(figsize=(szer/2.54, wys/2.54))
fig.subplots_adjust(left=.08, bottom=.08, right=.985, top=.94)
ax1 = plt.subplot(111)

opsv.plot_model()
# 2. plot deformed model
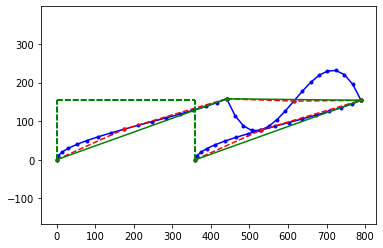
sfac = 80.

plt.figure()
# plot_defo with optional arguments
# sfac = opsv.plot_defo()
opsv.plot_defo(sfac, fmt_interp='b.-')
opsv.plot_defo(sfac, 5, interpFlag=0, fmt_nodes='bo-')
opsv.plot_defo(sfac, 3, endDispFlag=0, fmt_interp='r.--')
opsv.plot_defo(sfac, 2, fmt_interp='g.-')
80.0
# print(f'sfac: {sfac}')  # return sfac if automatically calculated

# 3. plot N, V, M forces diagrams

sfacN, sfacV, sfacM = 5.e-5, 5.e-5, 5.e-5

plt.figure()
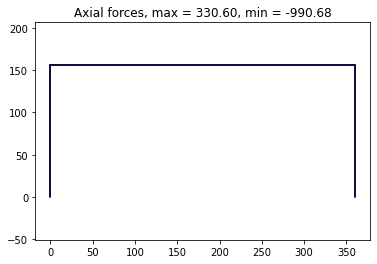
minVal, maxVal = opsv.section_force_diagram_2d('N', Ew, sfacN)
plt.title(f'Axial forces, max = {maxVal:.2f}, min = {minVal:.2f}')

plt.figure()
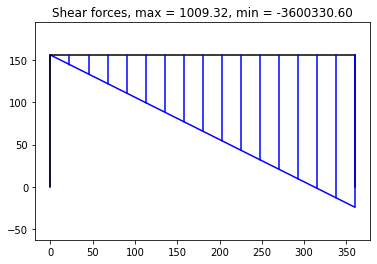
minVal, maxVal = opsv.section_force_diagram_2d('T', Ew, sfacV)
plt.title(f'Shear forces, max = {maxVal:.2f}, min = {minVal:.2f}')

plt.figure()
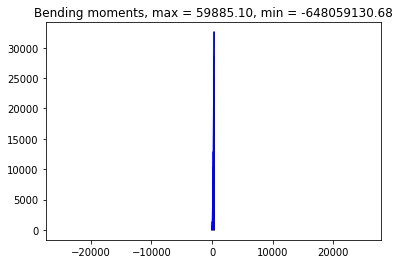
minVal, maxVal = opsv.section_force_diagram_2d('M', Ew, sfacM)
plt.title(f'Bending moments, max = {maxVal:.2f}, min = {minVal:.2f}')

plt.show()
