Basics in Python#
The sdof package exposes three basic Python functions:
integrate, andspectrum
[1]:
import sdof
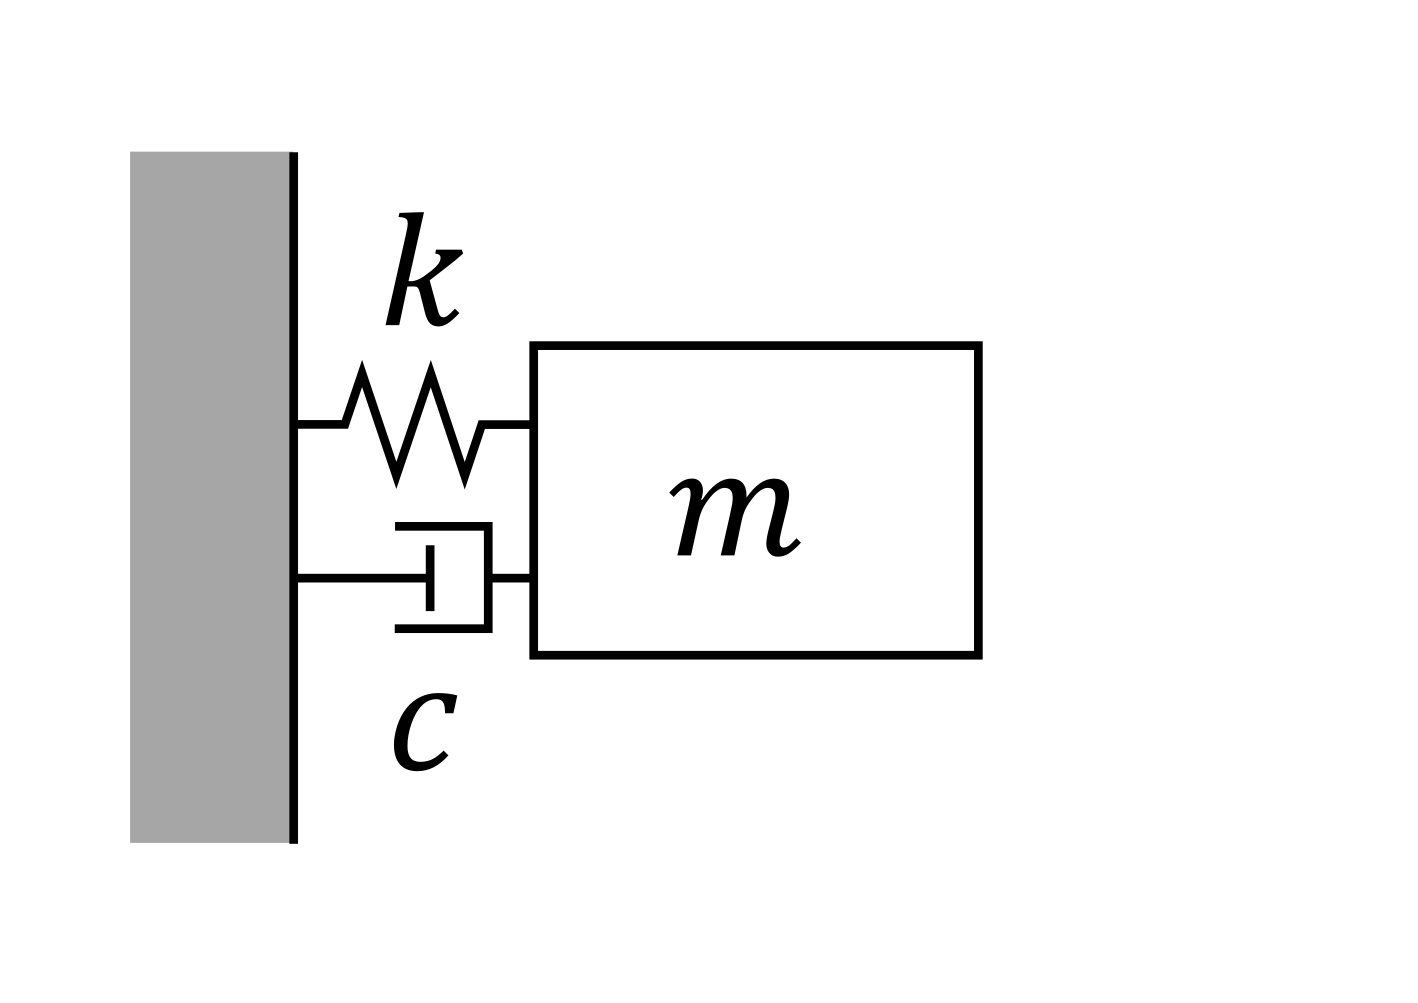
From Example 5.1 of Chopra 2012
\(m\) |
0.2533 |
\(c\) |
0.1592 |
\(k\) |
10 |
and excitation by a half-cycle sine pulse.
[14]:
m  =  0.2533 # kip-sec^2 / in
c  =  0.1592 #
k  = 10.0    # kips / in

dt = 0.10
f  = [  0.0000,
        5.0000,
        8.6603,
       10.0000,
        8.6603,
        5.0000,
        0.0000,
        0.0000,
        0.0000,
        0.0000,
        0.0000]
[15]:
U = sdof.integrate(m, c, k, f, dt)
[16]:
from pandas import DataFrame
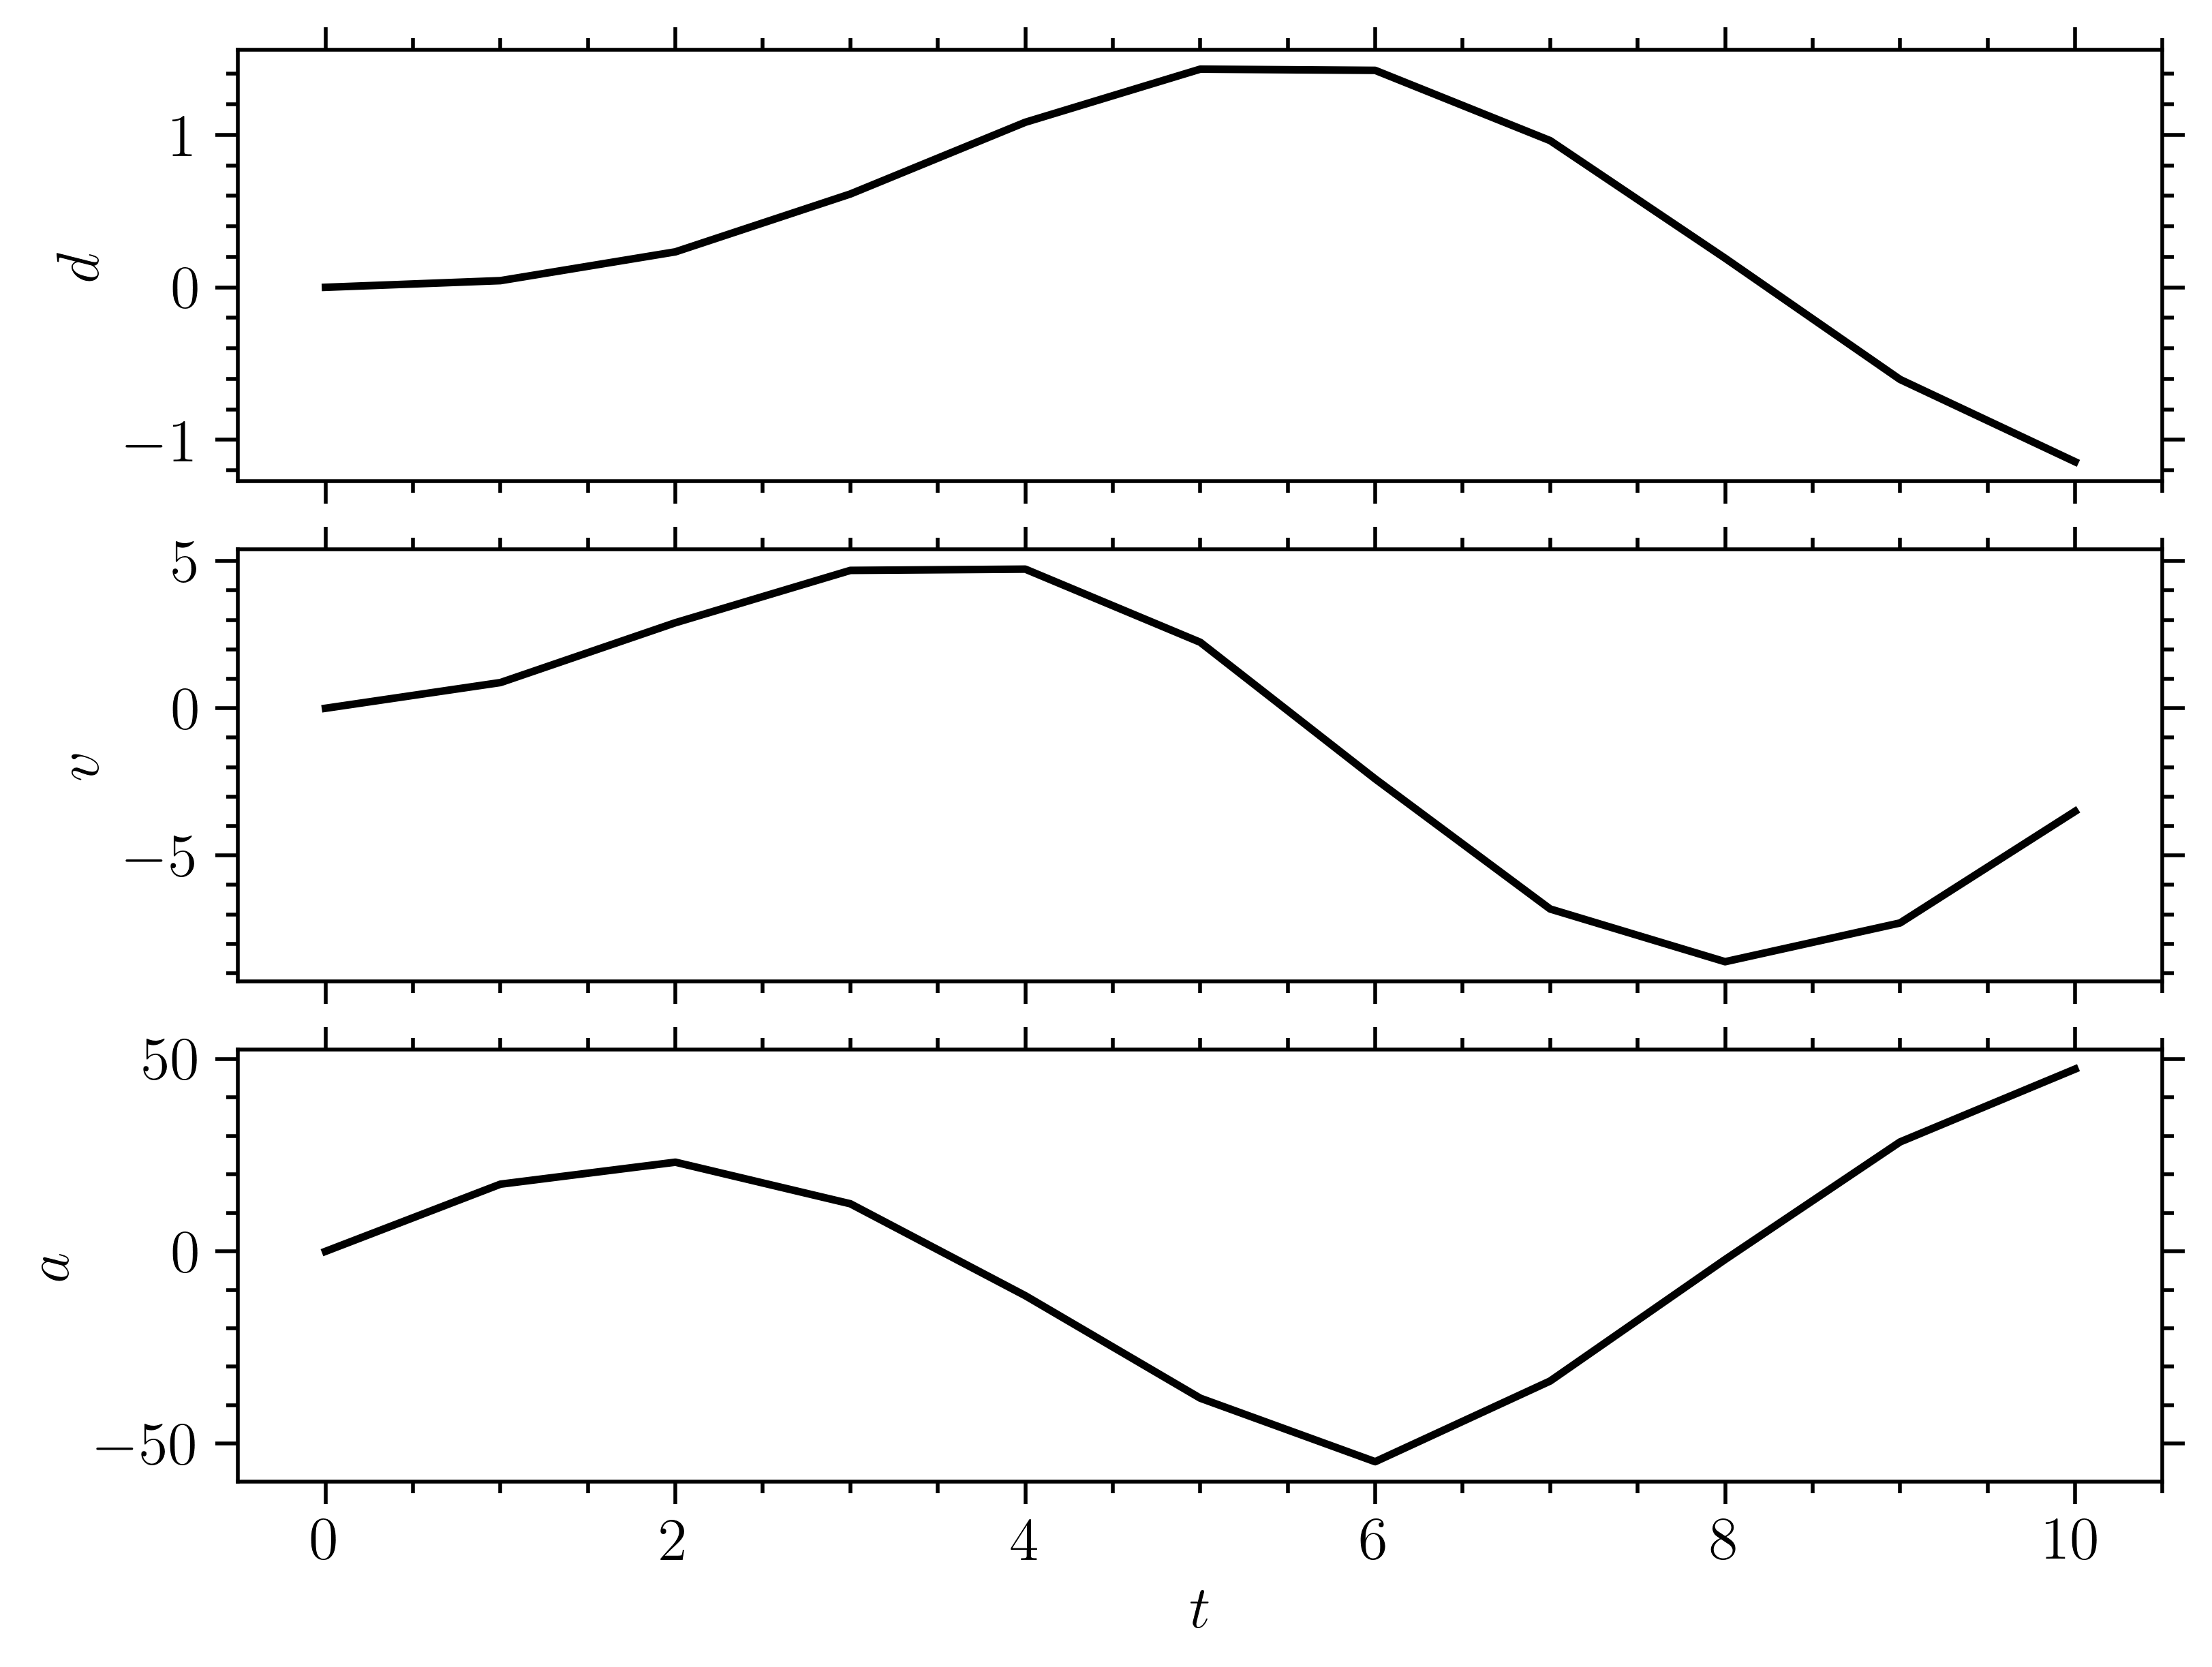
print(DataFrame(U.T))
           0         1          2
0   0.000000  0.000000   0.000000
1   0.043667  0.873332  17.466639
2   0.232617  2.905674  23.180211
3   0.612064  4.683275  12.371806
4   1.082528  4.725996 -11.517402
5   1.430931  2.242063 -38.161252
6   1.423053 -2.399618 -54.672371
7   0.962161 -6.818225 -33.699755
8   0.190786 -8.609266  -2.121077
9  -0.604337 -7.293202  28.442354
10 -1.144126 -3.502575  47.370190
[9]:
import matplotlib.pyplot as plt

fig, axes = plt.subplots(3, sharex=True, constrained_layout=True)

for i, ax in enumerate(axes):

    ax.plot(U[i,:])
    ax.set_ylabel(f'${"uva"[i]}$')

ax.set_xlabel("$t$");
[9]:
Text(0.5, 0, '$t$')
[11]:
import numpy as np
print(sdof.peaks(
        1., 0., 1.,
        np.loadtxt("elCentro.txt"), 0.01
).max_accel)
0.0
[17]:
import matplotlib.pyplot as plt

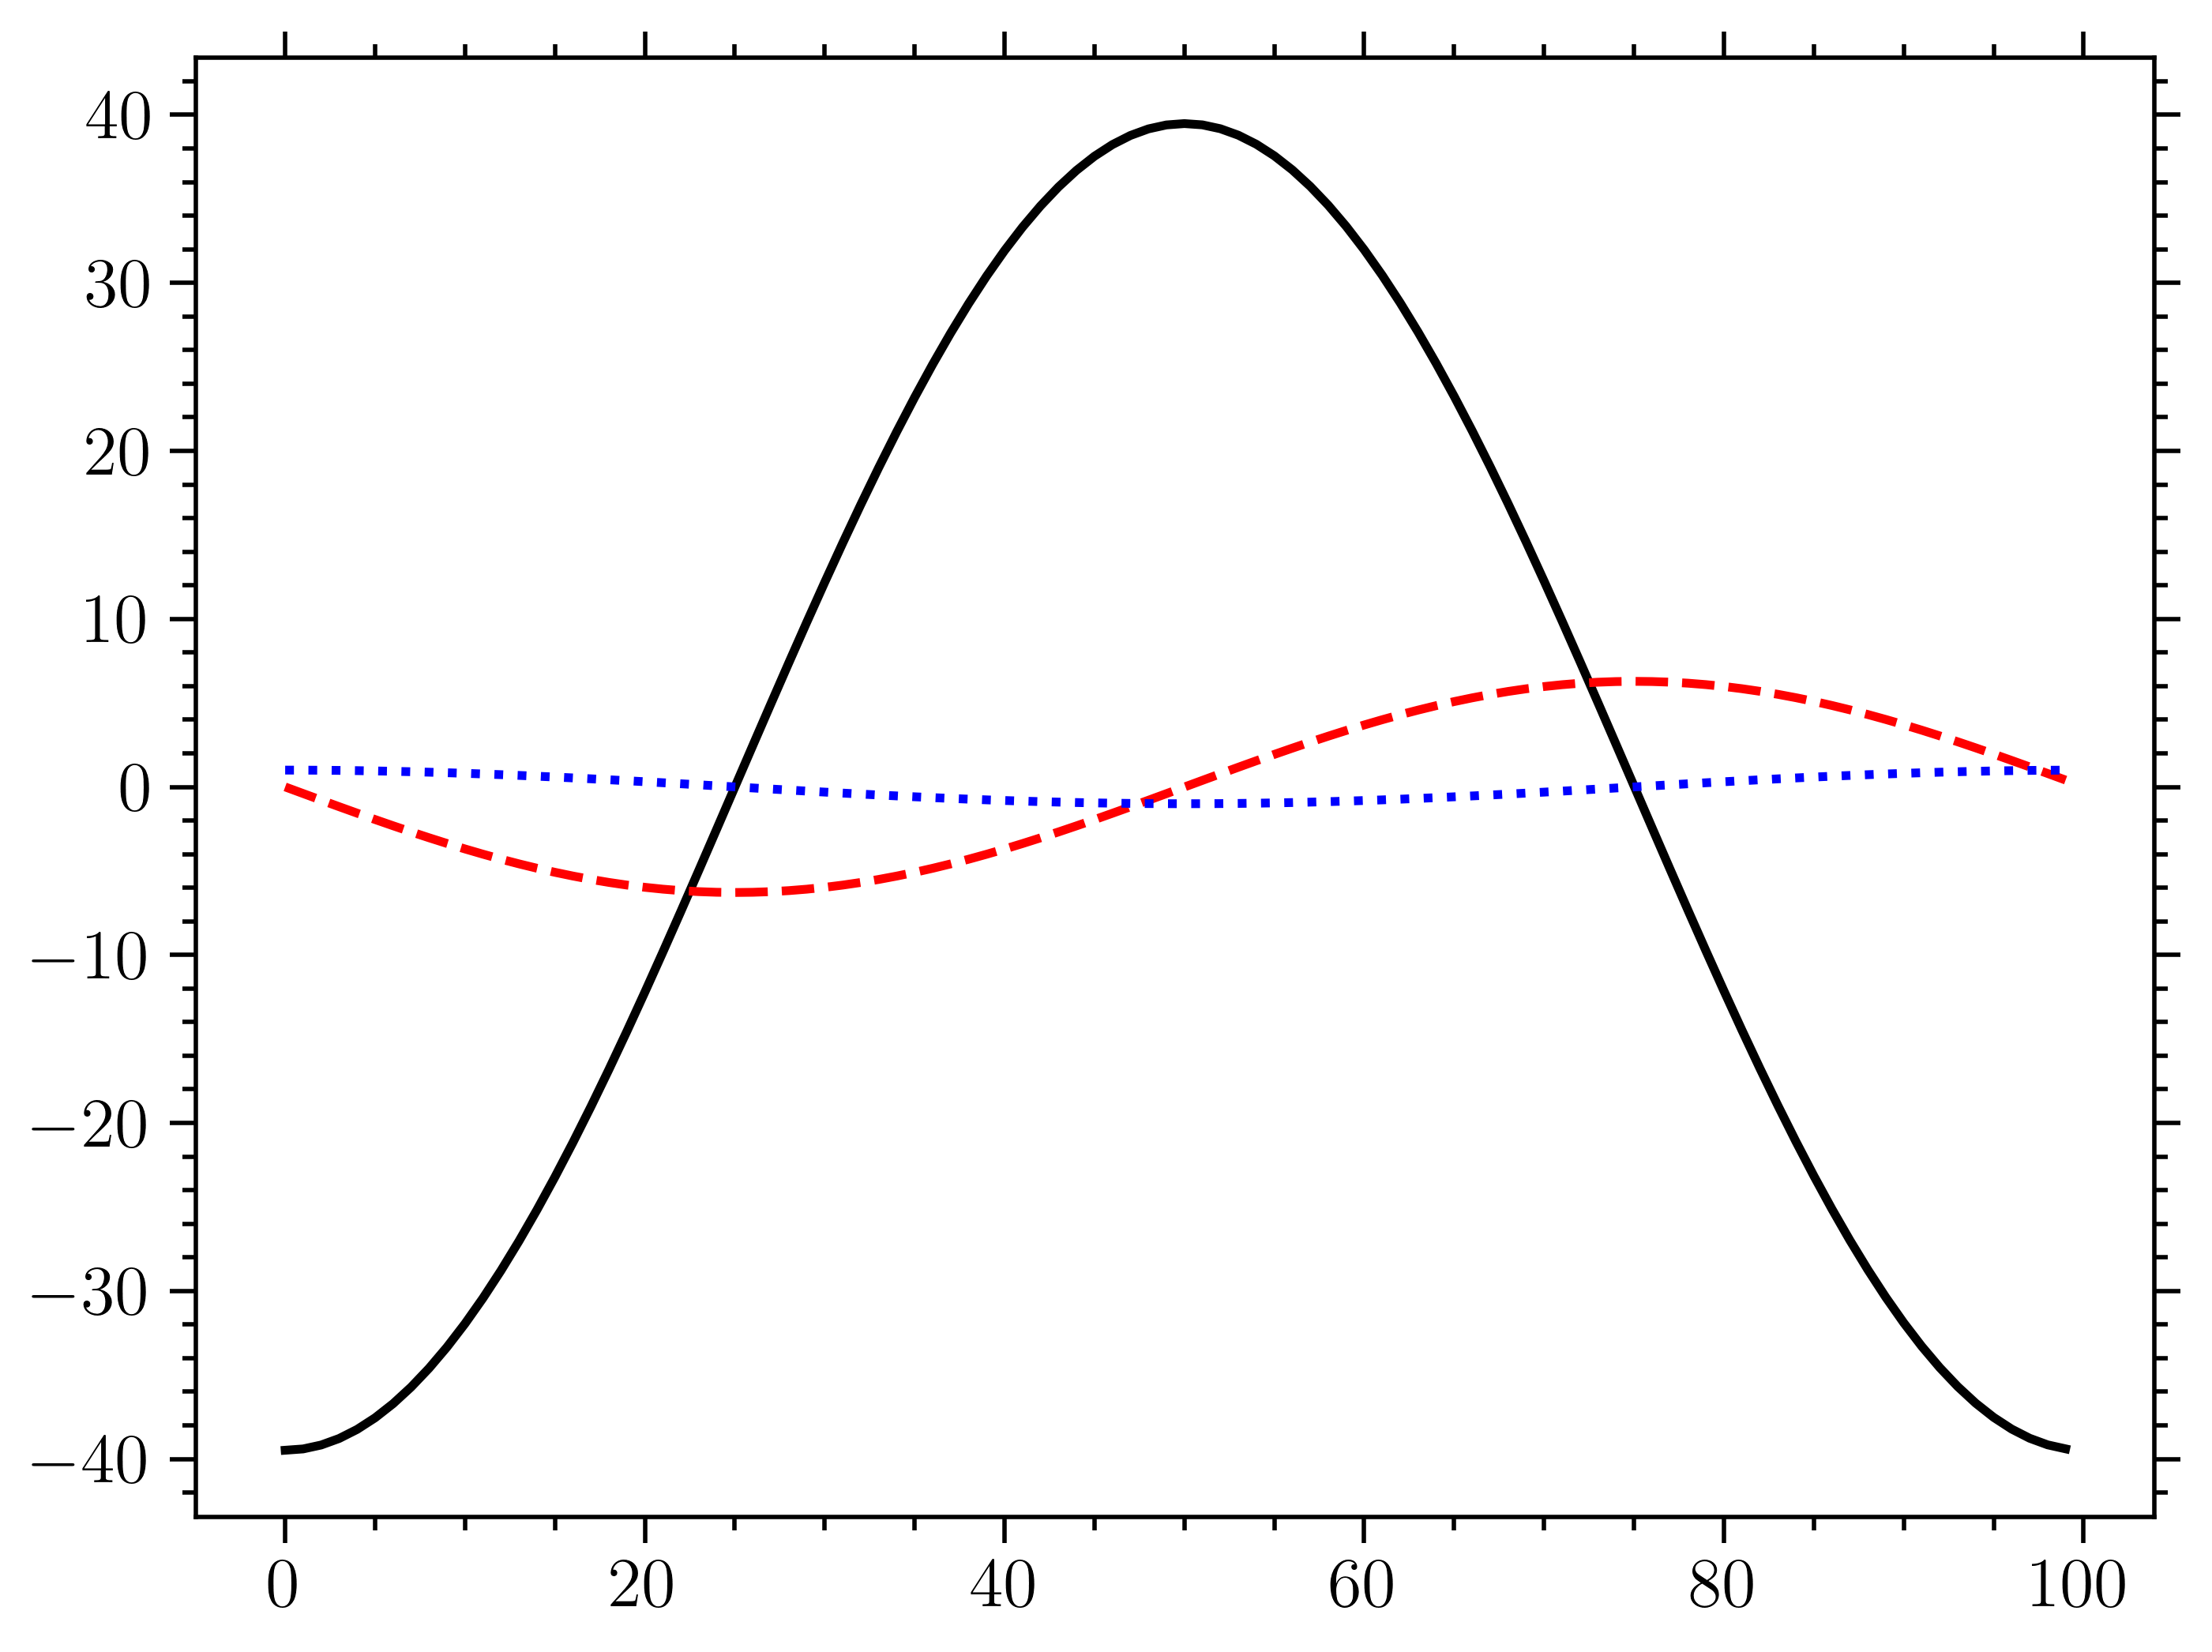
u,v,a = sdof.integrate(0.2533, 0.0, 10., np.zeros(100), 0.01, u0=1.0)

fig, ax = plt.subplots()
ax.plot(a)
ax.plot(v)
ax.plot(u)
plt.show()
[6]:
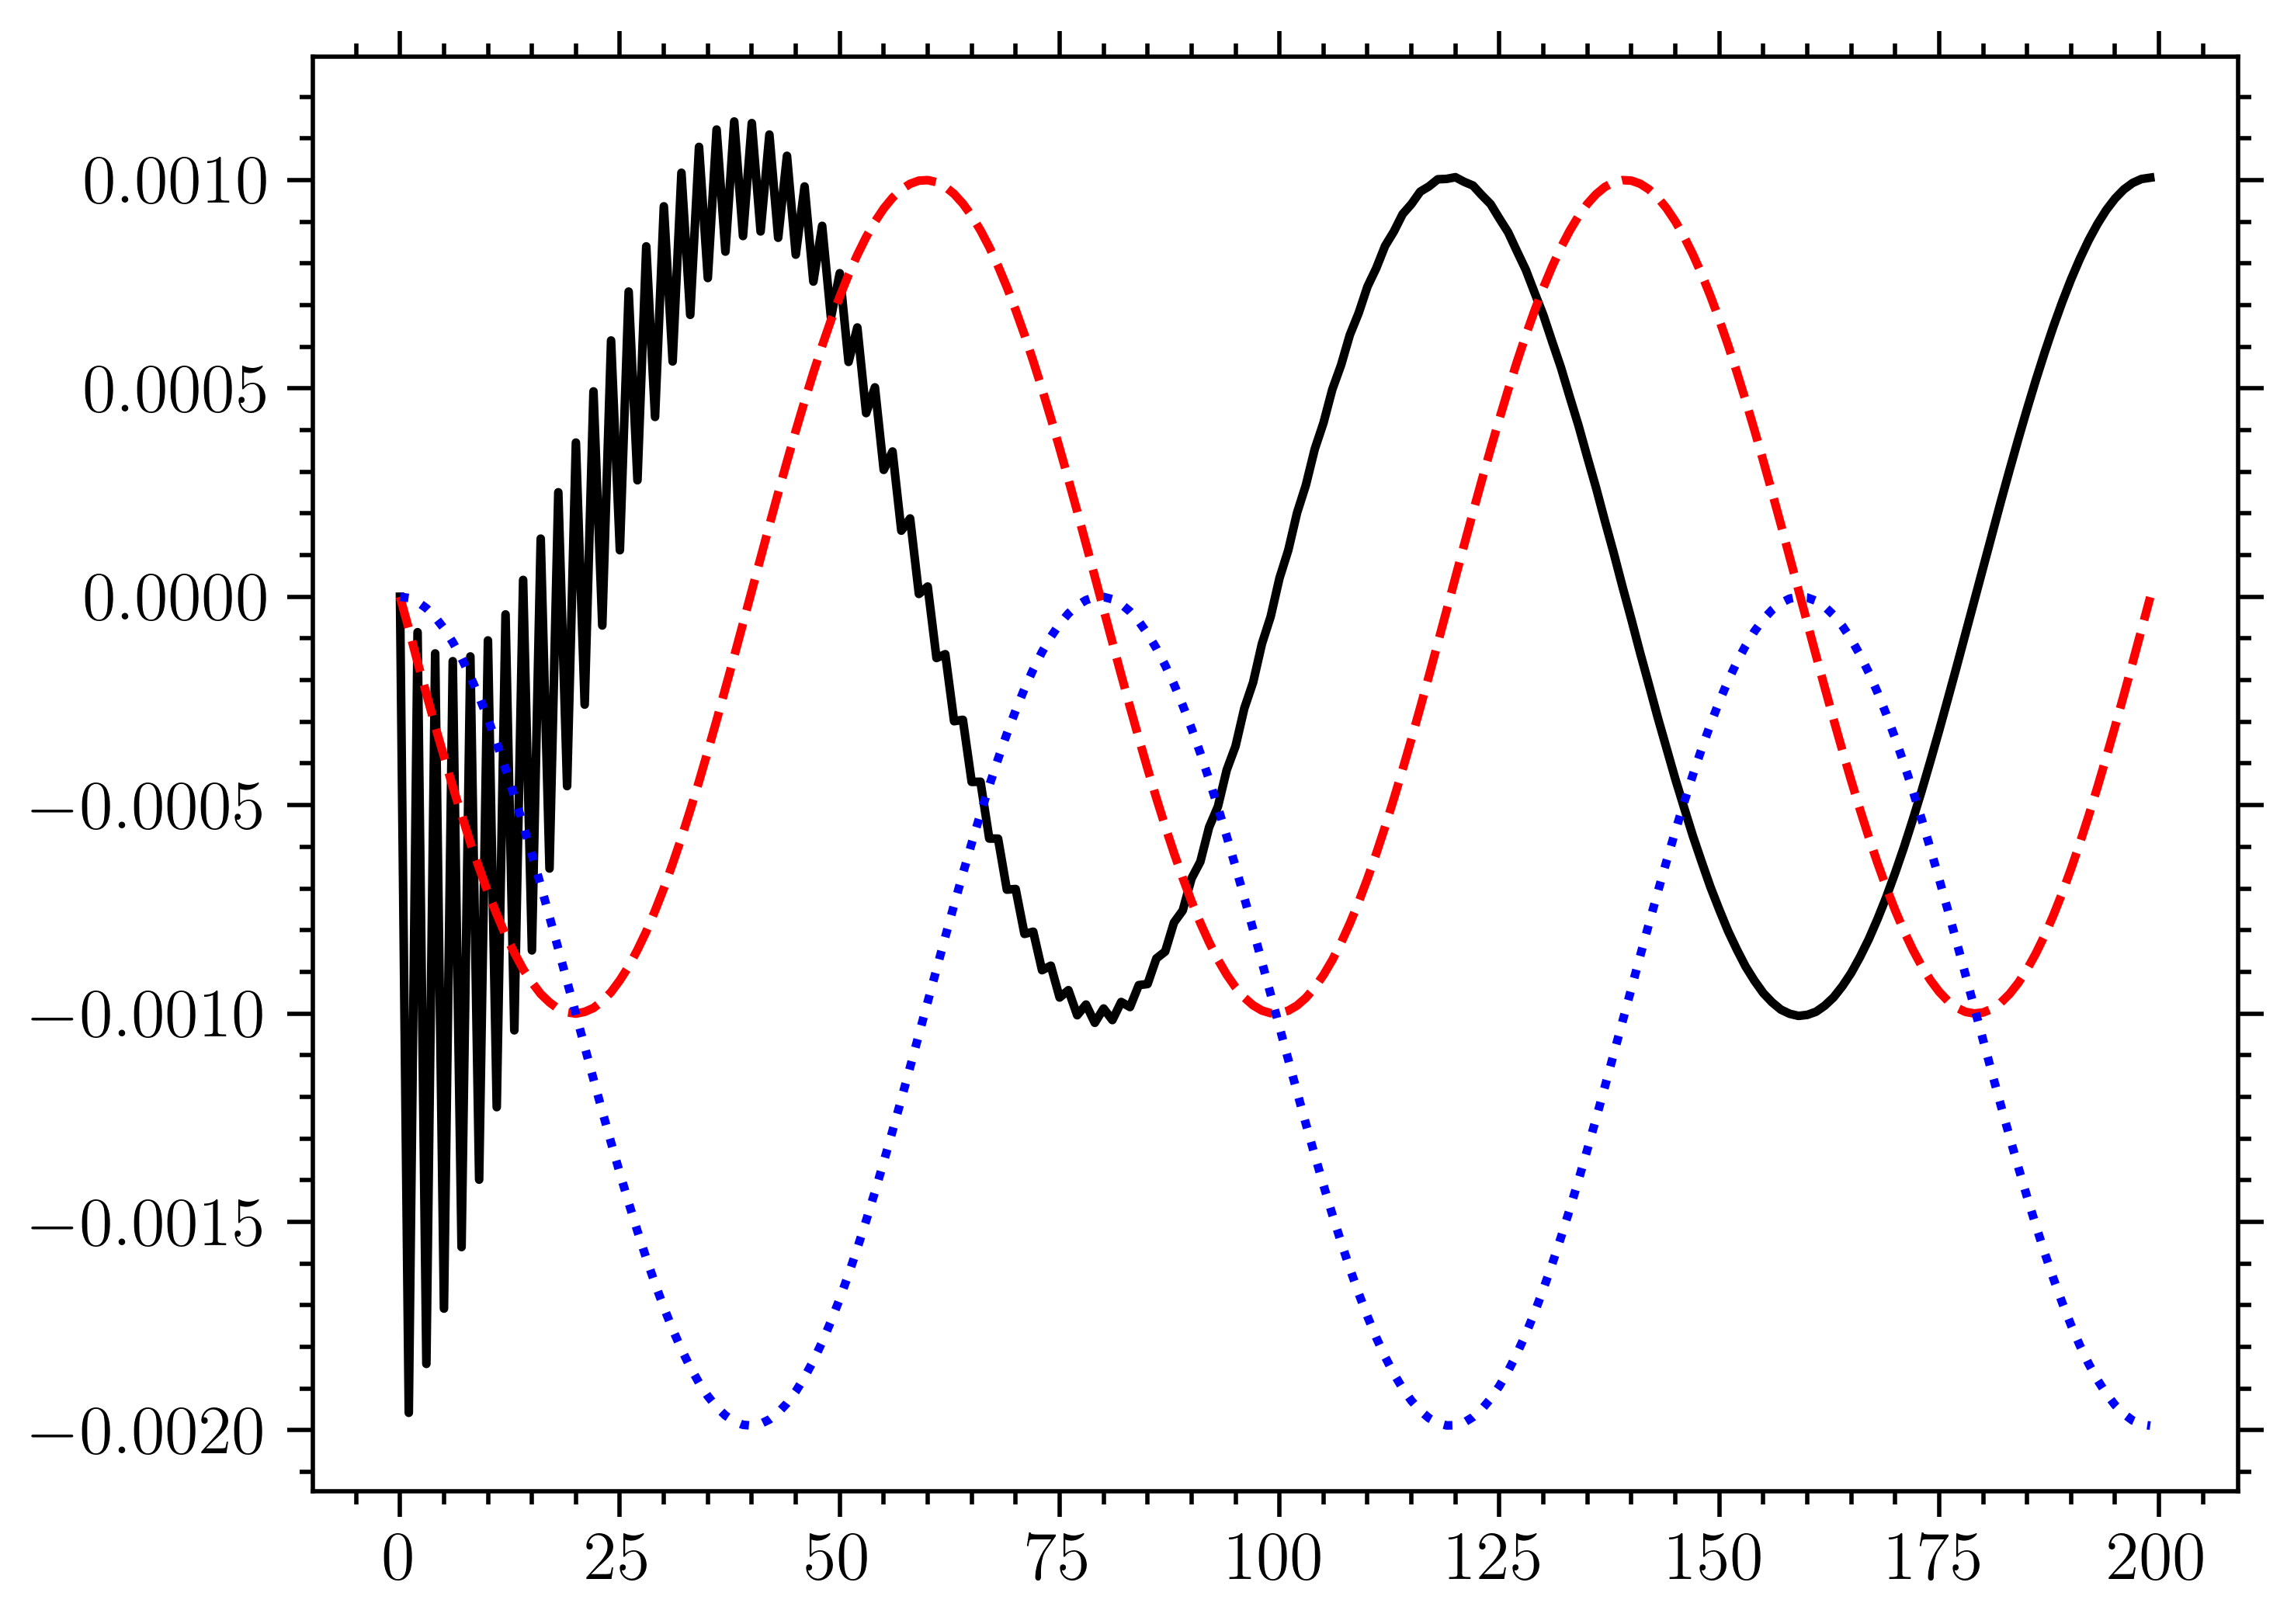
u,v,a = sdof.integrate(
        1., 1.e3, 0.,
        -np.sin(np.linspace(0, 5*np.pi, 200)), 5*np.pi/200
)

fig, ax = plt.subplots()
ax.plot(a)
ax.plot(v)
ax.plot(u)
[21]:
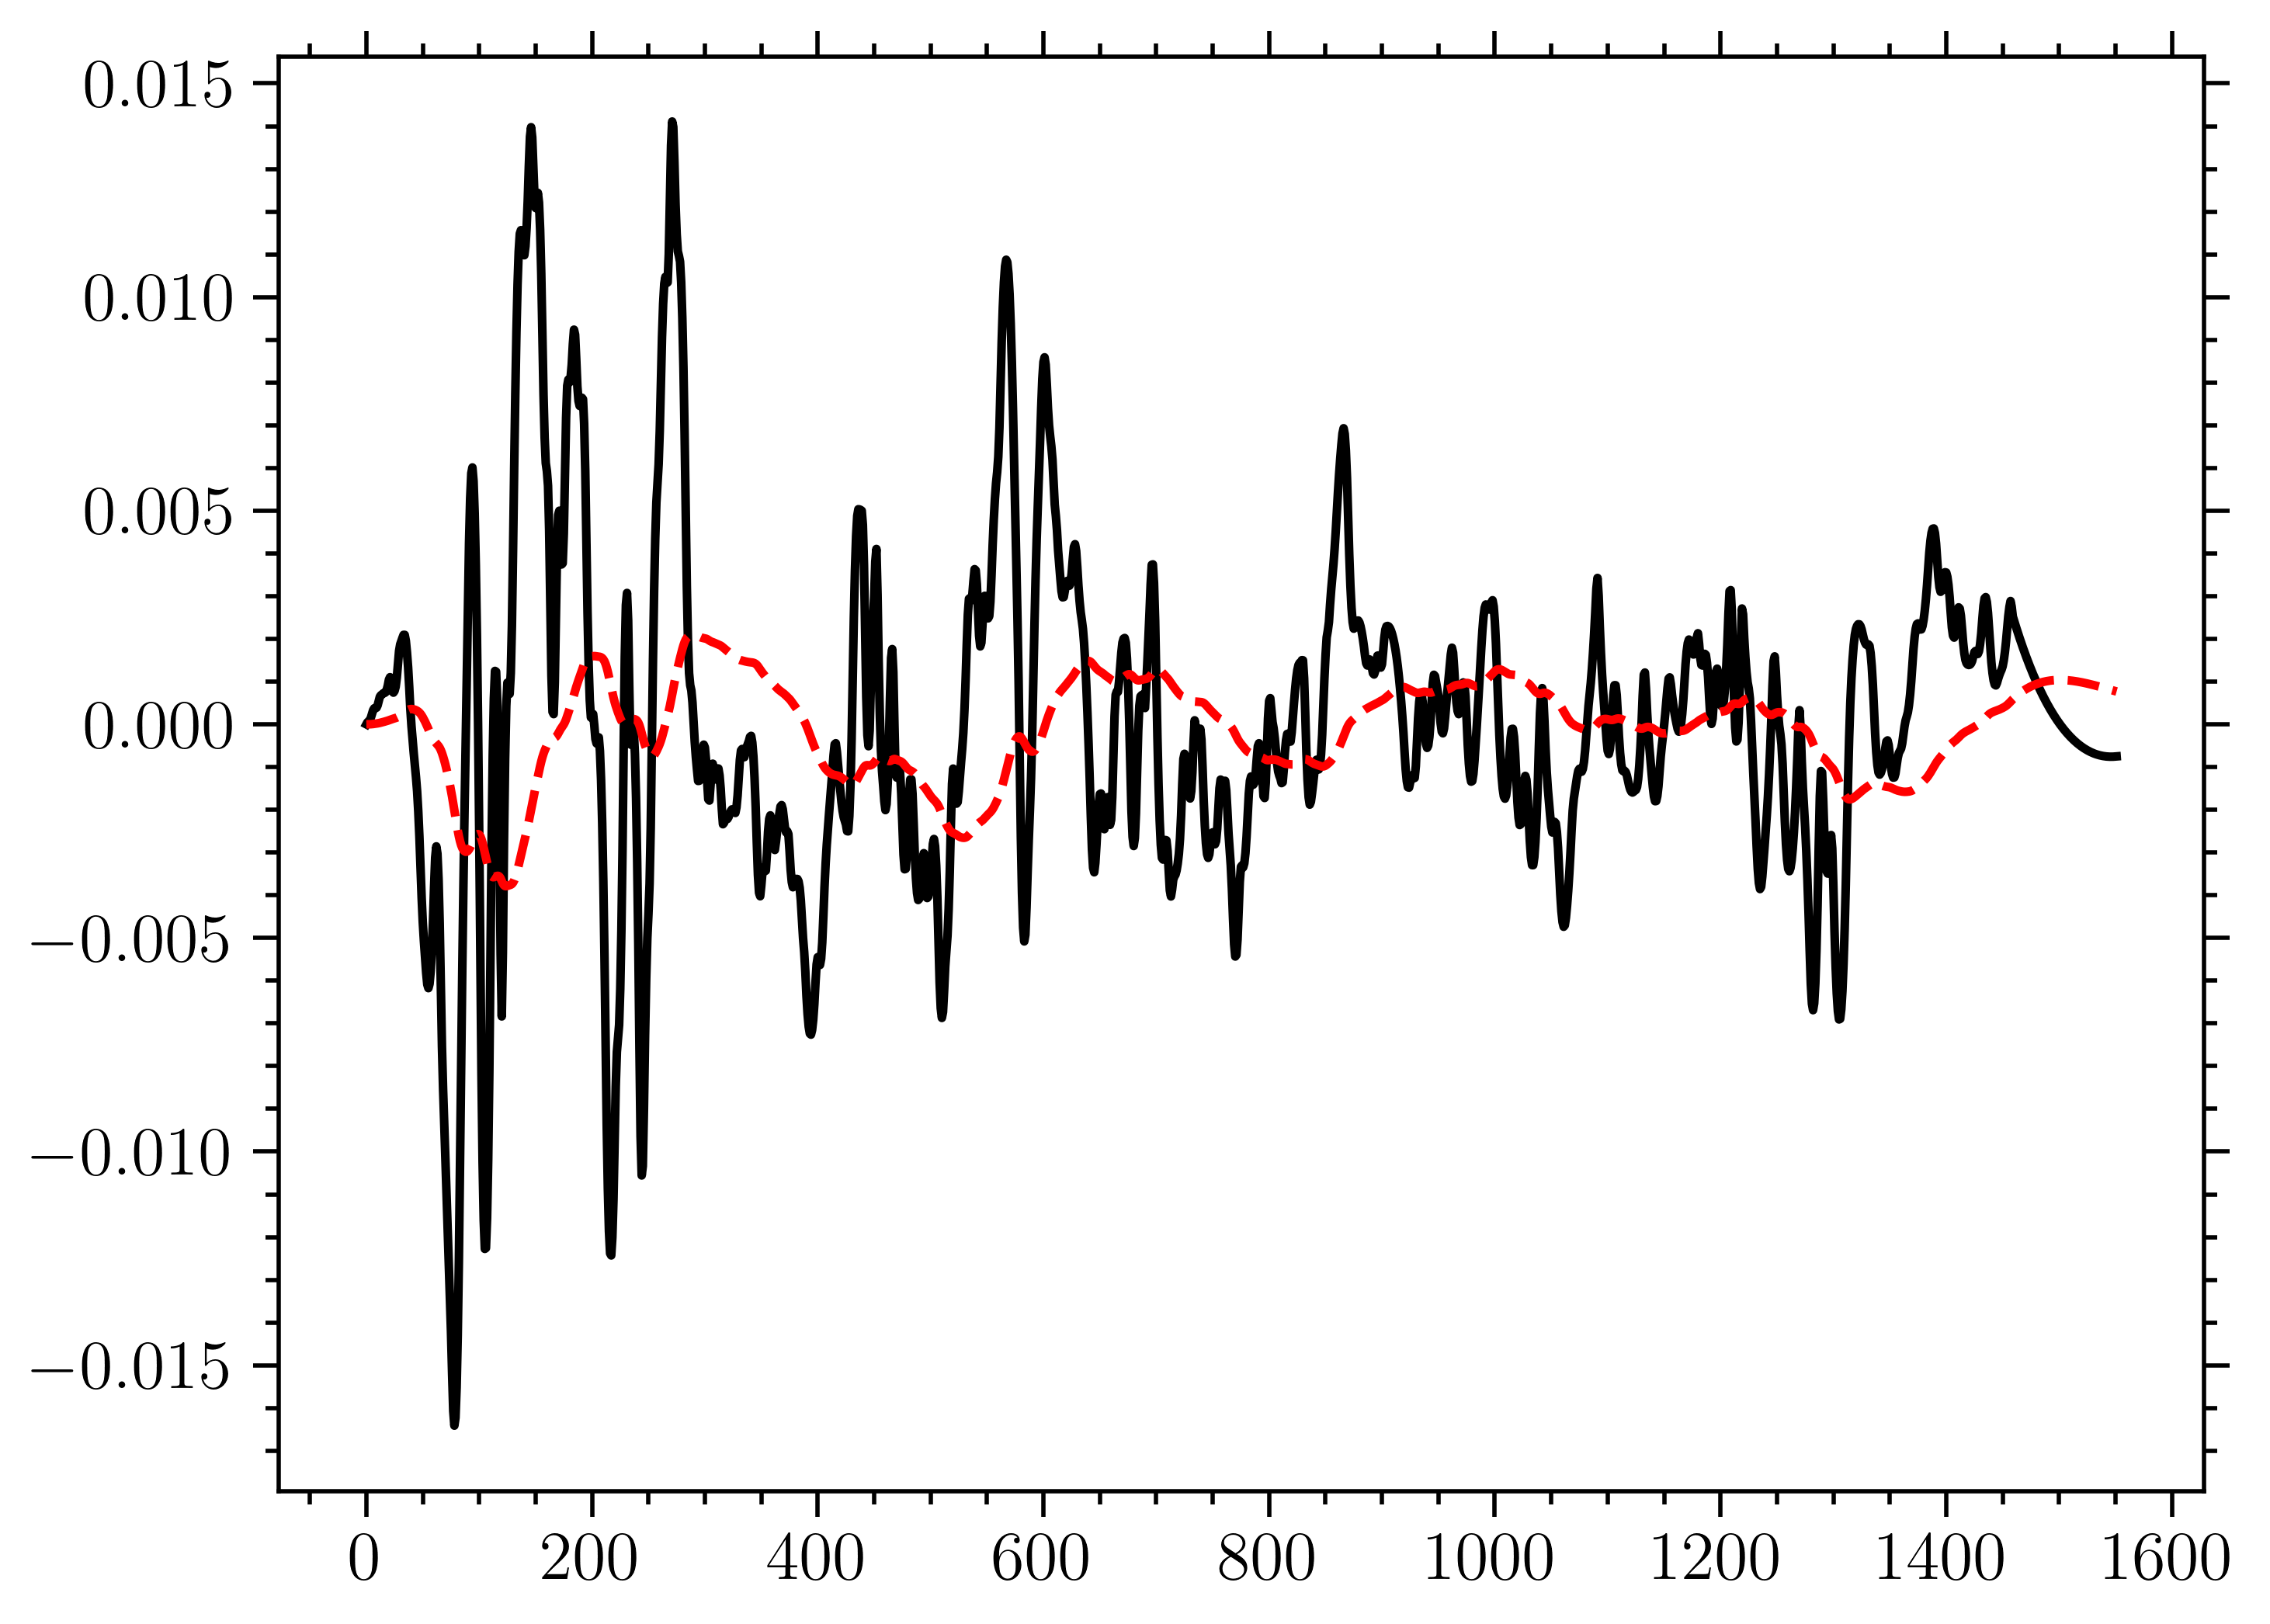
f = np.loadtxt("elCentro.txt")
u,v,a = sdof.integrate(
        1., 1., 0.,
        f, 0.01
)
fig, ax = plt.subplots()
# ax.plot(f)
# ax.plot(a)
ax.plot(v)
ax.plot(u)
plt.show()
[ ]: